CIMAP: Clustering for Identification of Muscle Activation Patterns
The accurate temporal analysis of muscle activation is of great interest in several research areas, spanning from neurorobotic systems to the assessment of altered locomotion patterns in orthopaedic and neurological patients and the monitoring of their motor rehabilitation. However, due to the high intra-cycle variability of the muscle activation patterns [1], specific algorithms are needed to help scientists to easily characterize and assess muscle activation patterns during cyclical movements. CIMAP is a python algorithm based on agglomerative hierarchical clustering that aims at characterizing muscle activation patterns during cyclical movements by grouping cycles with similar muscle activity. More specifically, CIMAP allows for widening our understanding of muscle activation patterns by applying hierarchical clustering techniques to muscle activation intervals (i.e., onset and offset time-instants of muscle activations). The CIMAP algorithm was specifically developed [2] and optimized [3] to assess muscle activity patterns during walking in both physiological and pathological conditions and it was successfully applied to the study of gait asymmetry in healthy, orthopaedic, and neurological patients. From muscle activation intervals to the graphical representation of the clustering results, the proposed algorithm offers a complete analysis framework for assessing muscle activation patterns that can be applied to cyclical movements different from walking. The algorithm can be flexibly modified at need to comply with the necessities of the user. CIMAP is addressed to scientists of any programming skill level working in different research areas such as biomedical engineering, robotics, sports, clinics, biomechanics, and neuroscience.
CIMAP is an algorithm, that was developed and optimized to perform pattern analysis on muscle activation intervals during gait analysis. The method addresses the issue of the high intra-subject variability that each subject has when performing a cyclical task [4], as it is while walking. The current version of the algorithm can be flexibly modified at need and applied to cyclical movements different from walking. For the algorithm to work properly the cycles that are given as input to CIMAP has to be time-normalized to a fixed number of sample to remove the bias introduced by biological time differences in the performance of the task. All the information regarding the data format are given in the Data Requirements section. In case of bilateral acquisitions the cycles belonging to the same muscle, but from different sides, are merged and all the processing steps are applied as they were from the same muscle. The cycles are divided again into sides when obtaining the results of the application of the algorithm.
Algorithm Workflow
The typical workflow when using the CIMAP algorithm consists of the following five main steps:
1. Dataset preparation
From input data (muscle activation intervals), muscle activation onset and offset (i.e., the beginning and the end of each muscle activation, respectively) time instants are extracted for the following steps. Notice that input data should be formatted as described in the Data Requirements section.
2. Dataset pre-processing
First, muscle activation intervals identified as outliers (i.e., cycles characterized by always ON or always OFF activation patterns) are removed. Second, if the original sEMG signals were acquired bilaterally, the left and the right sides are pulled together to increase the total number of cycles available for the cluster analysis. Notice that the algorithm can work also considering muscle activation intervals extracted from a single side (if a sufficient number of cycles is present). Then, cycles are divided into several sub-datasets grouping together cycles showing the same number of muscle activations within the cycle (called modalities). Sub-datasets containing a number of cycles lower than an empirically defined threshold (Th)are discarded. This threshold was recently set equal to 10 cycles per modality to allow CIMAP application during walking in pathological conditions (i.e., patients can walk independently only for a few strides) [5].
3. Agglomerative hierarchical clustering of each sub-dataset
Agglomerative hierarchical clustering is applied to each sub-dataset, separately. Starting from a number of clusters equals to the number of cycles (i.e., each cluster contains a single cycle), agglomerative hierarchical clustering iteratively merges the two “closest” clusters until a single cluster is obtained. The complete linkage method [6] is used to select the two clusters to be merged. According to this method, the farthest distance between every pair of clusters’ elements is considered as merging criterion. During the linkage process, two different distance metrics are computed separately: the Manhattan (L1 norm) and the Chebychev (L inf norm) distance. Thus, two different dendrograms are computed. To identify the cutoff points and define the final number of clusters, a cutoff rule is applied to each dendrogram, separately. The cutoff rule consists of three different criteria, each based on the inter-cluster distances between consecutive iterations of the agglomerative hierarchical clustering process. Please refer to the study by Rosati et al. [3] for a complete description of the cutoff rule implemented in CIMAP. Finally, after comparing the dendrograms obtained using the Manhattan and the Chebychev distance metrics, results showing the lowest intra-cluster variability are considered as definitive results [3]. Once the agglomerative hierarchical clustering of the considered sub-dataset is concluded, for each cluster, left and right cycles (if available) are separated into two different clusters, allowing you to study asymmetry in muscle activation patterns during movements.
4. Results representation
Graphical representations of the cluster analysis results are available at each step of the algorithm workflow:
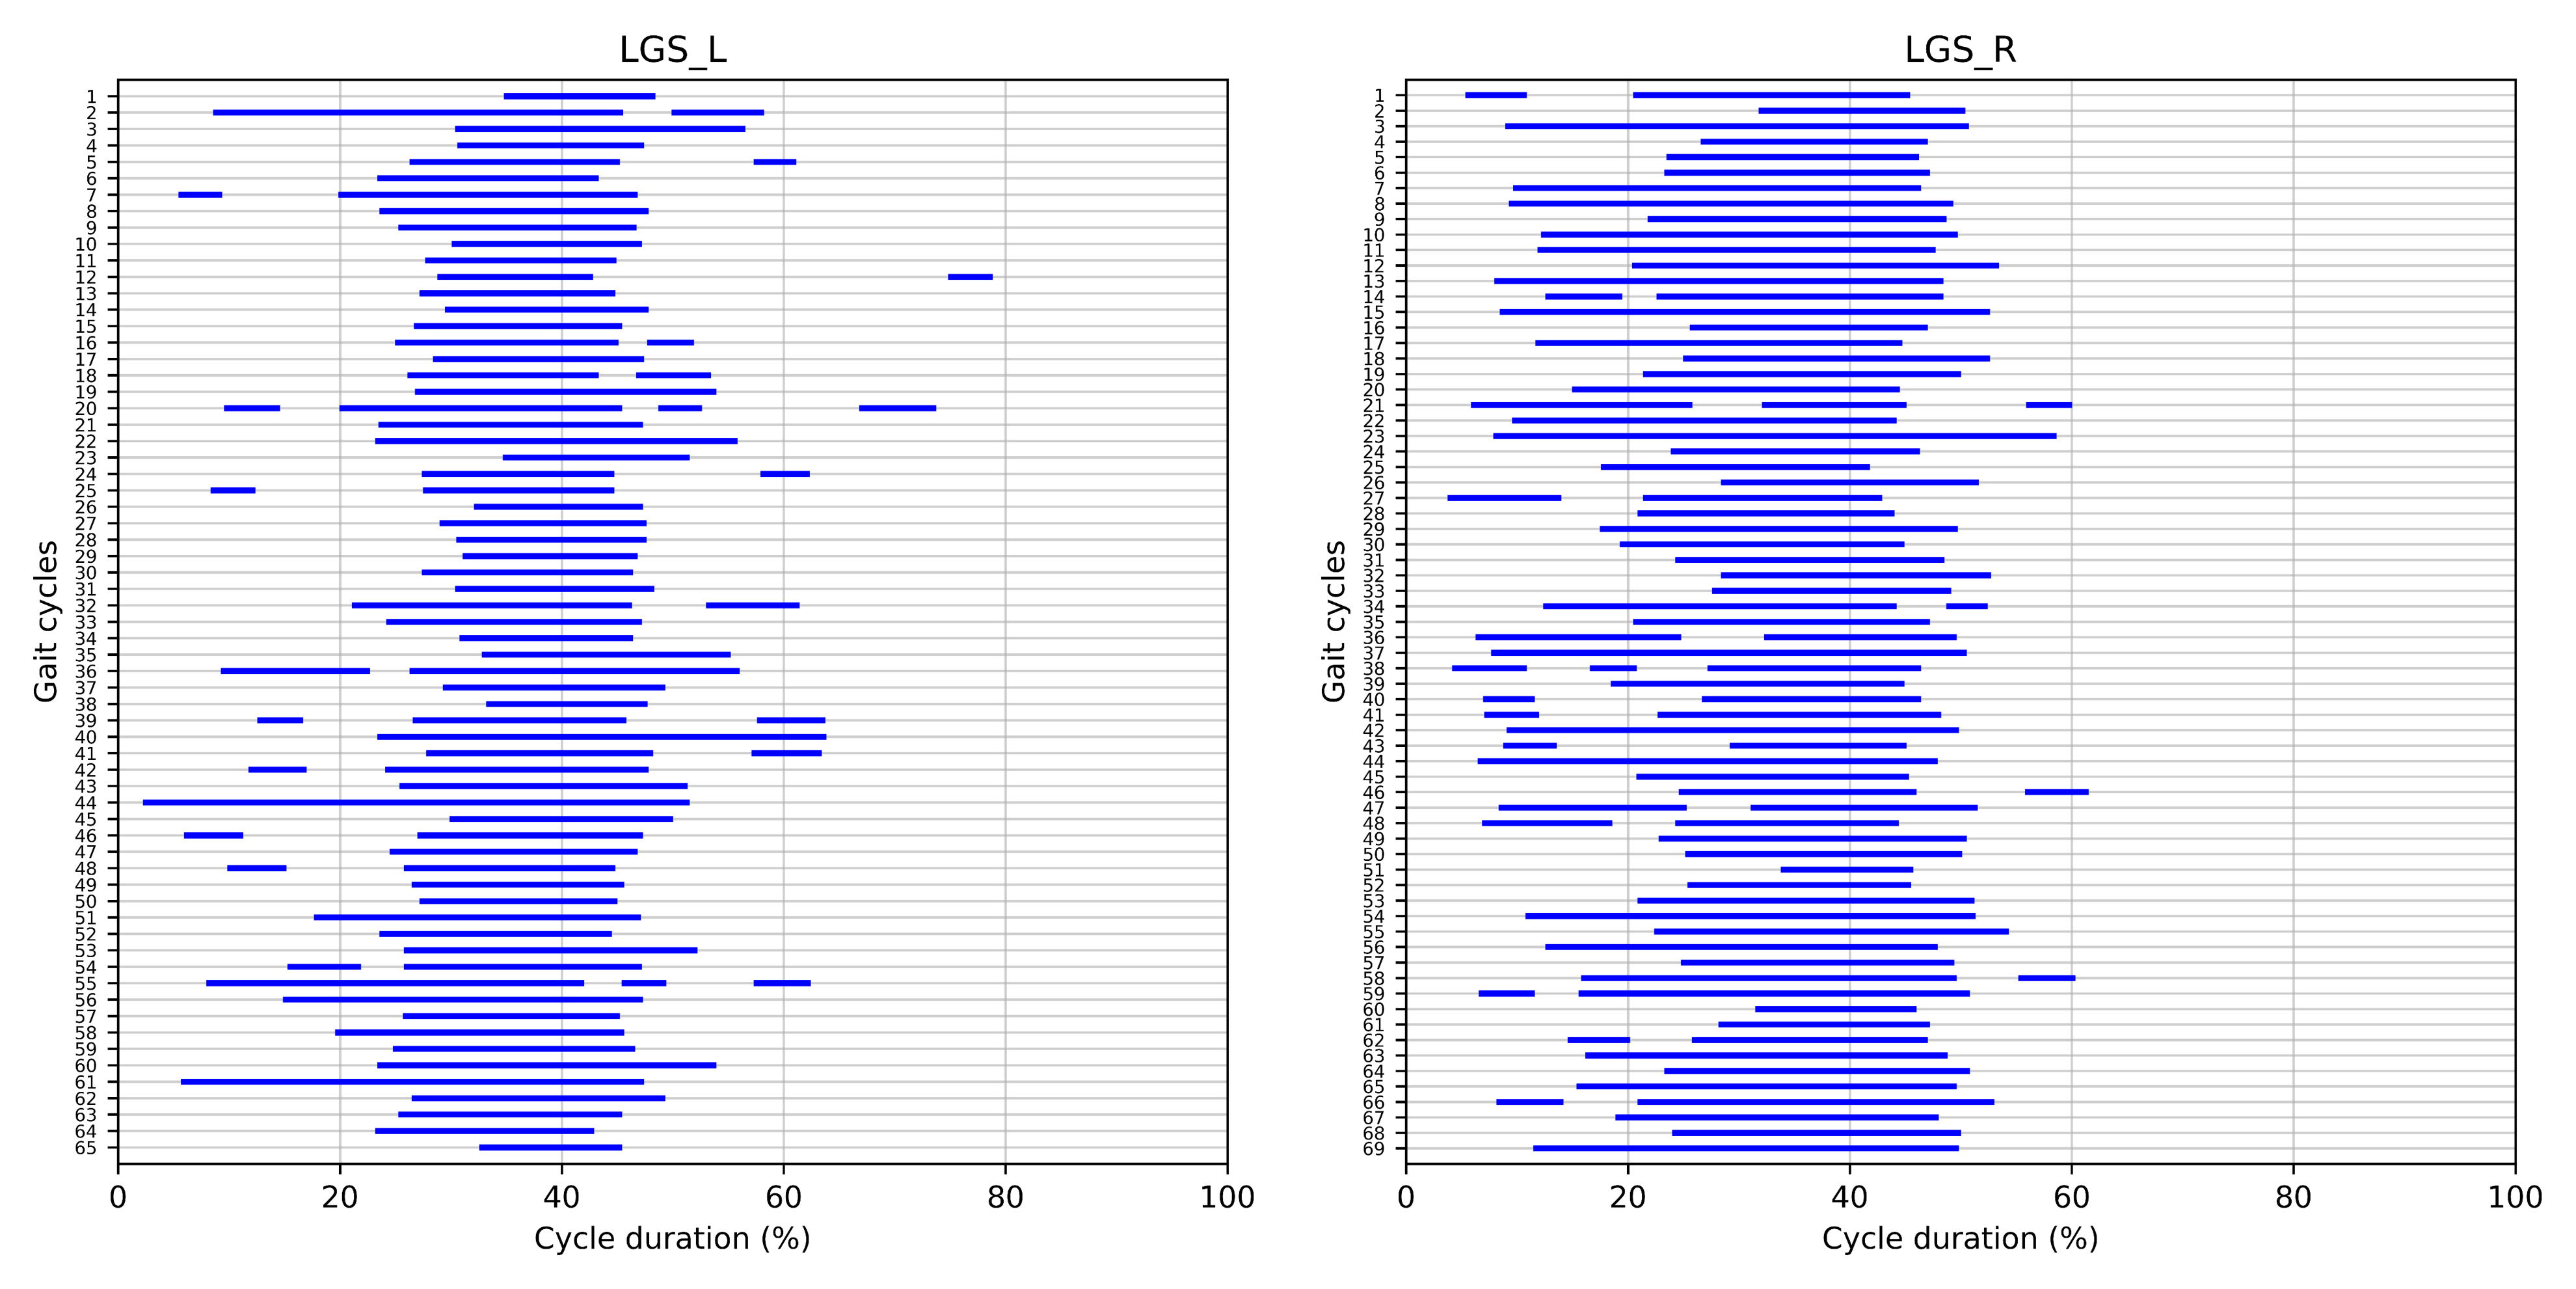
Dataset preparation: muscle activation intervals can be represented over time for each acquired muscle and side, separately.

Figure 1 | Muscle activation intervals extracted from the left and Lateral Gastrocnemius (LGS) muscle of a healthy subject during overground walking at self-selected speed. Blue lines represent muscle activation intervals normalized into 1000 time points with respect to the cycle duration. This representation was generated using `CIMAP` v1.1.0.
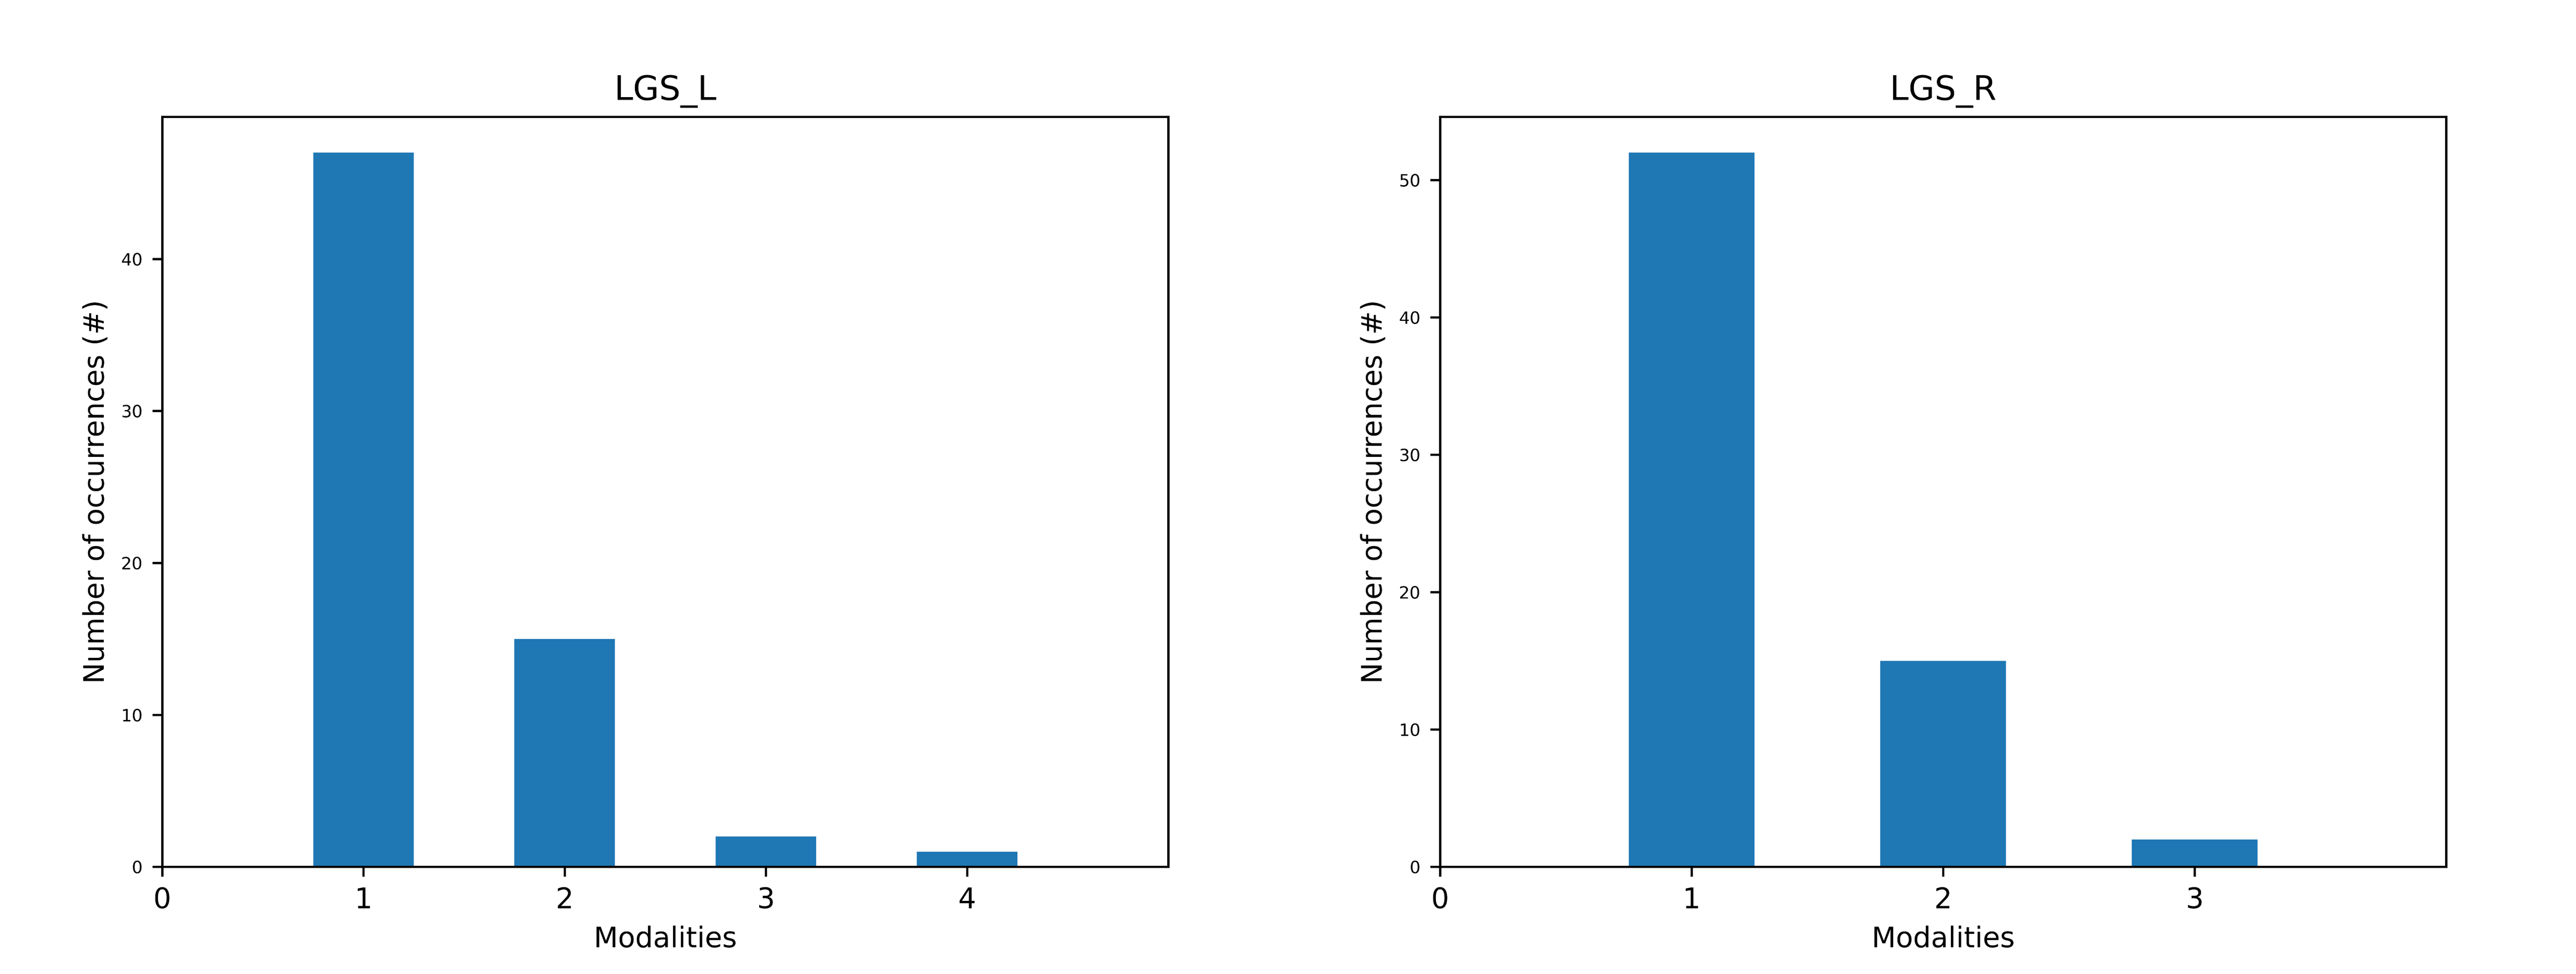
Data pre-processing: occurrences of muscle activation modalities can be represented through histograms for each acquired muscle and side, separately.

Figure 2 | Occurrences of sEMG activation patterns of the left and right Lateral Gastrocnemius (LGS) muscle of a healthy subject during overground walking at self-selected speed. For each side, it is shown the number of gait cycles belonging to each modality. This representation was generated using `CIMAP` v1.1.0.
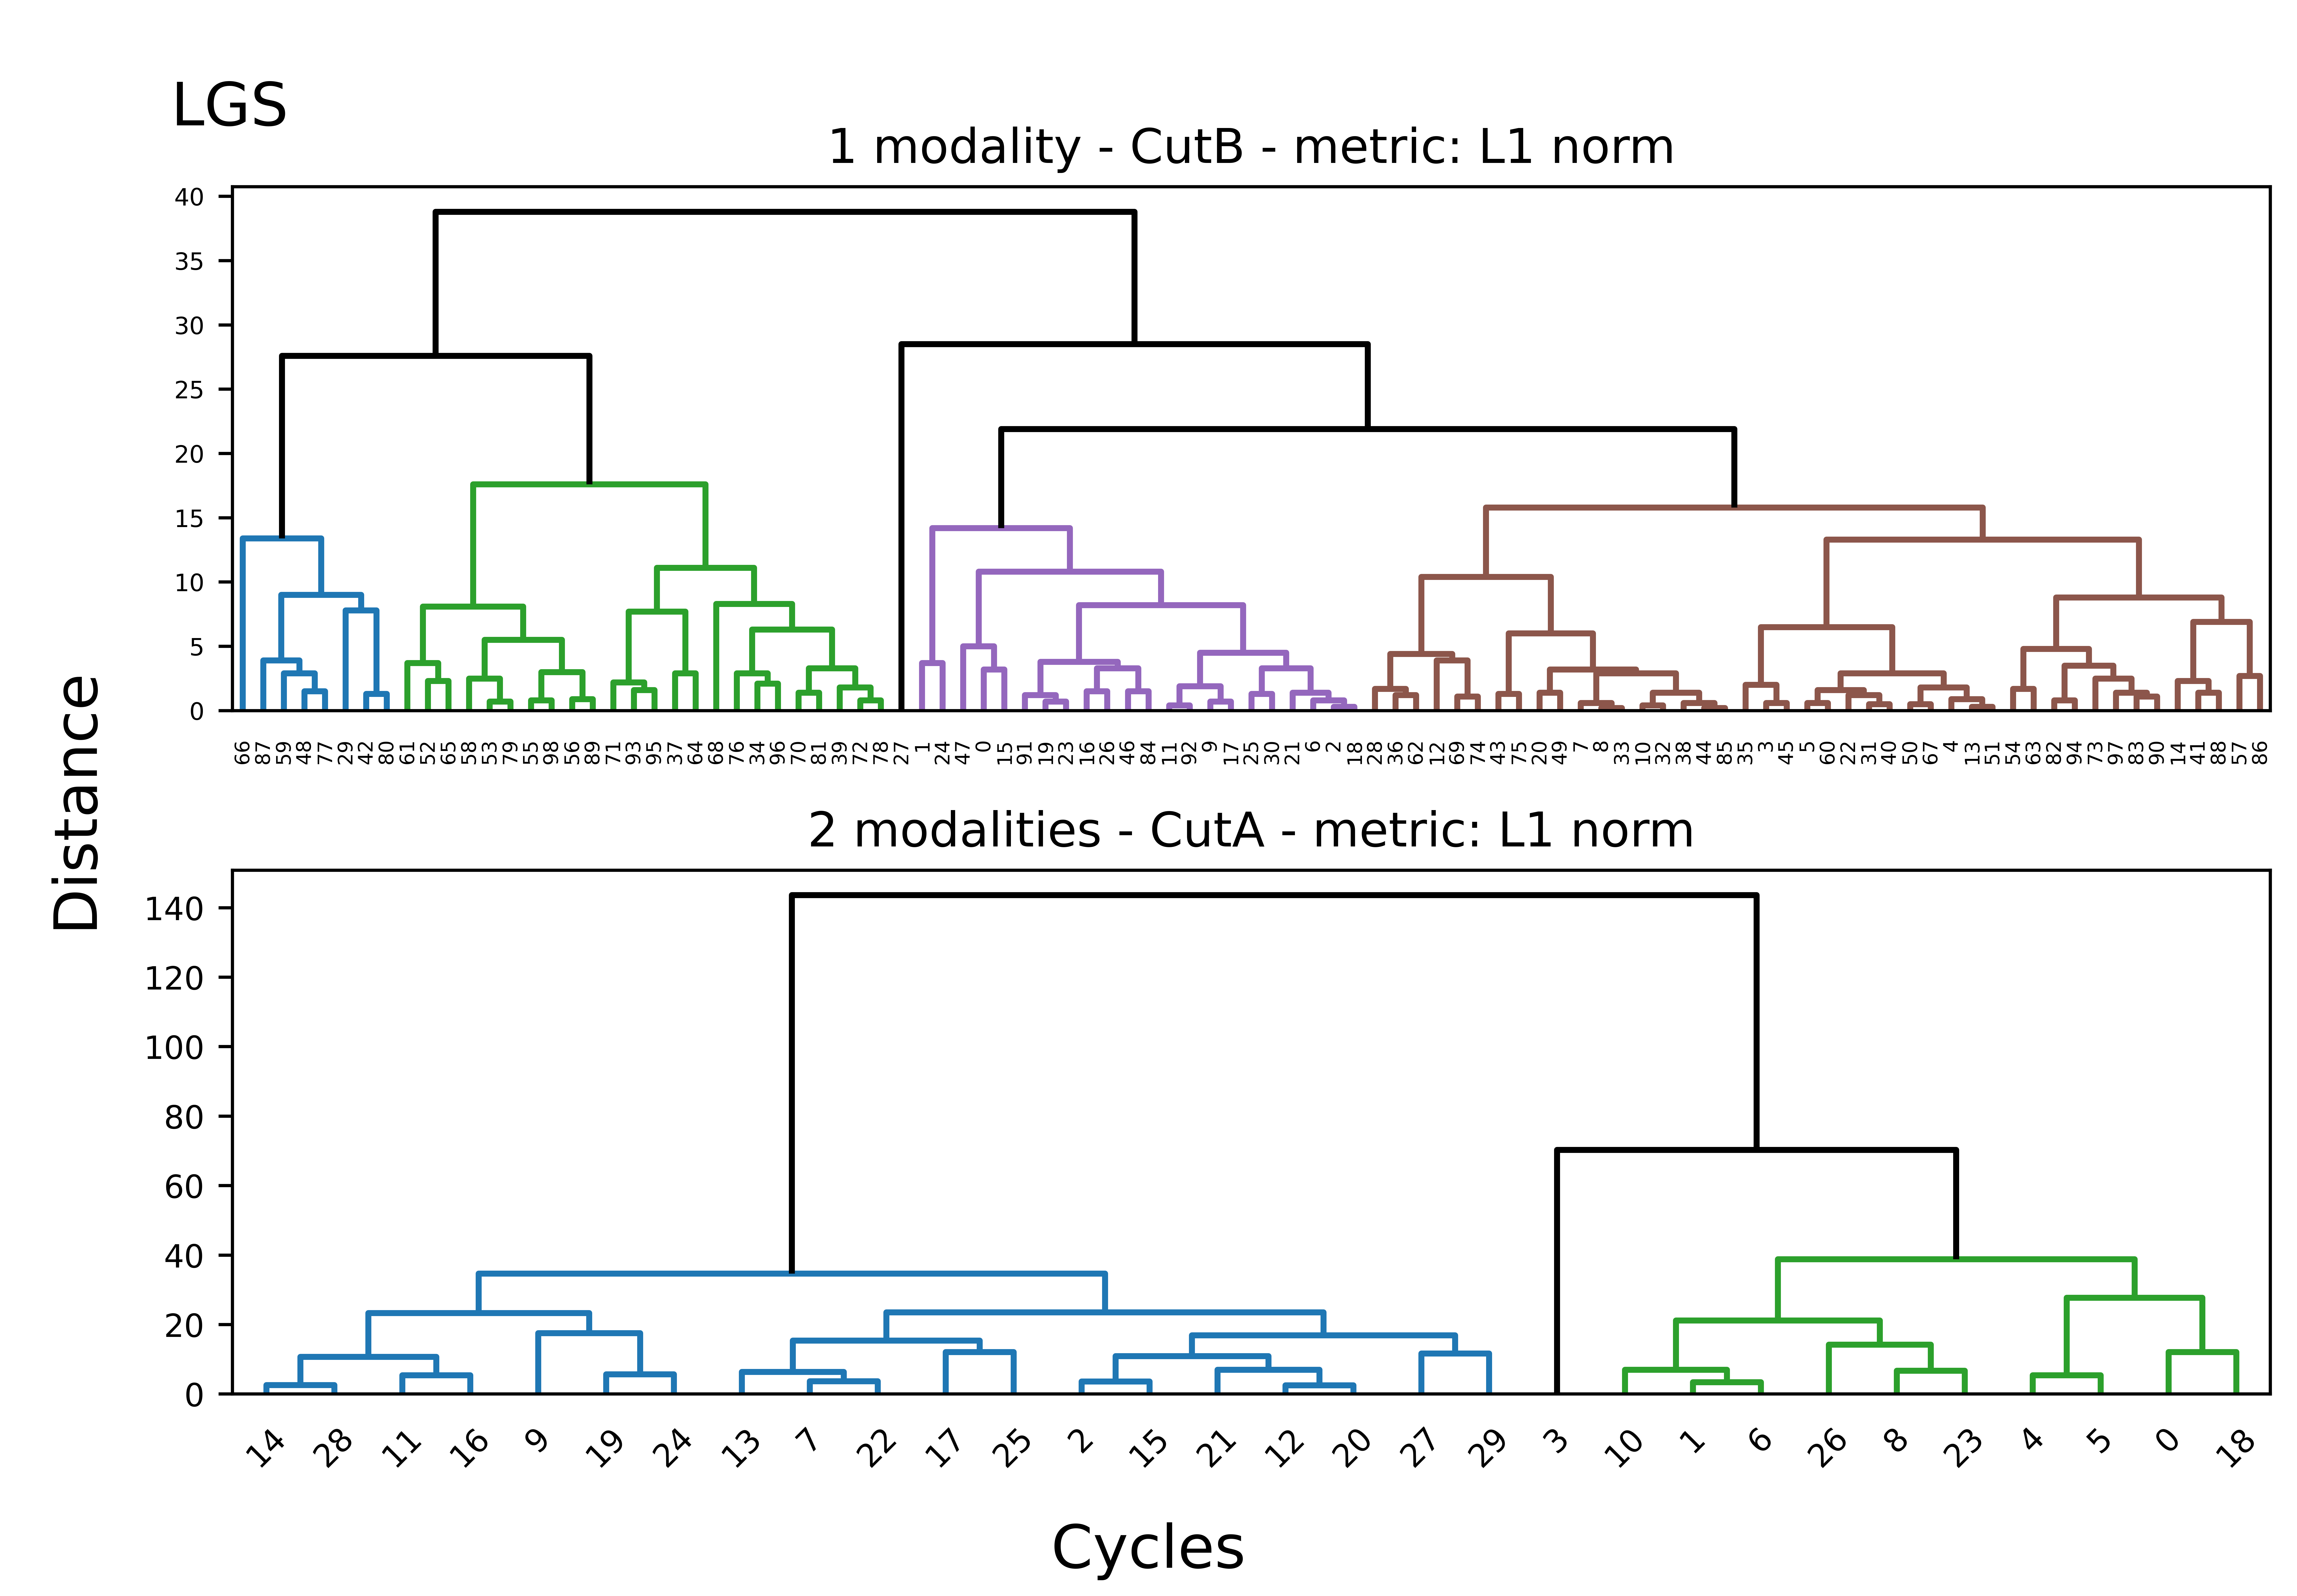
Agglomerative hierarchical clustering of each sub-dataset: cluster analysis performed on cycles showing a specific modality can be represented for each muscle through dendrograms with the indication of the selected cutoff point and clusters.

Figure 3 | Dendrograms of hierarchical cluster analysis performed on cycles showing a single activation interval (top) and on cycles showing two different activation intervals (bottom), separately. Clusters obtained after the selection of the optimal cutoff point are represented in different colours. SEMG activation intervals were extracted from the Lateral Gastrocnemius (LGS) muscle of a representative healthy subject during a 5-minute overground walking at a self-selected speed. This representation was generated using `CIMAP` v1.1.0.
5. Data saving
According to FAIR principles, clustering results are saved in an easy-to-read and open-source (.csv file) format to increase results’ accessibility, interpretability, and interoperability. Please refer to the Data Requirements section for additional details on CIMAP output.
Application Example
An application example is available in the Applying CIMAP to gait analysis section. The dataset that is used in the example is the same that is already available in the Github repository in the example_data folder.
Cite CIMAP algorithm
If you are using the CIMAP algorithm in your study, please cite the following article by Dotti et al. [7].
How to contribute
Thank you for your interest in our algorithm and for taking the time to read this document. Please refer to the Contributing section for a complete guide on how to contribute to the CIMAP algorithm.
References
[1]. D.A. Winter, H.J. Yack, EMG profiles during normal human walking: stride-to-stride and inter-subject variability, Electroencephalography and Clinical Neurophysiology, Volume 67, Issue 5, 1987, doi: 10.1016/0013-4694(87)90003-4.
[2]. S. Rosati, V. Agostini, M. Knaflitz, and G. Balestra, Muscle activation patterns during gait: A hierarchical clustering analysis, Biomed. Signal Process. Control, vol. 31, pp. 463–469, 2017, doi: 10.1016/j.bspc.2016.09.017.
[3]. S. Rosati, C. Castagneri, V. Agostini, M. Knaflitz, and G. Balestra, Muscle contractions in cyclic movements: Optimization of CIMAP algorithm, 2017, doi: 10.1109/EMBC.2017.8036762.
[4]. V. Agostini, A. Nascimbeni, A. Gaffuri, P. Imazio, M.G. Benedetti, M. Knaflitz, Normative EMG activation patterns of school-age children during gait, Gait & Posture, Volume 32, Issue 3, 2010, Pages 285-289, ISSN 0966-6362, https://doi.org/10.1016/j.gaitpost.2010.06.024.
[5]. G. Dotti, M. Ghislieri, S. Rosati, V. Agostini, M. Knaflitz, G. Balestra, (2021, November). The Effect of Number of Gait Cycles on Principal Activation Extraction. In Annual International Conference of the IEEE Engineering in Medicine and Biology Society. IEEE Engineering in Medicine and Biology Society. Annual International Conference (Vol. 2021, pp. 985-988).
[6]. L. Kaufman and P. J. Rousseeuw, Finding groups in data : an introduction to cluster analysis. Wiley, 2005.
[7]. G. Dotti, M. Ghislieri, C. Castagneri, V. Agostini, M. Knaflitz, G. Balestra, and S. Rosati, "An Open-Source Toolbox for Enhancing the Assessment of Muscle Activation Patterns during Cyclical Movements", Physiol. Meas. 2024, 45, 105004, doi:10.1088/1361-6579/ad814f.