Data Requirements
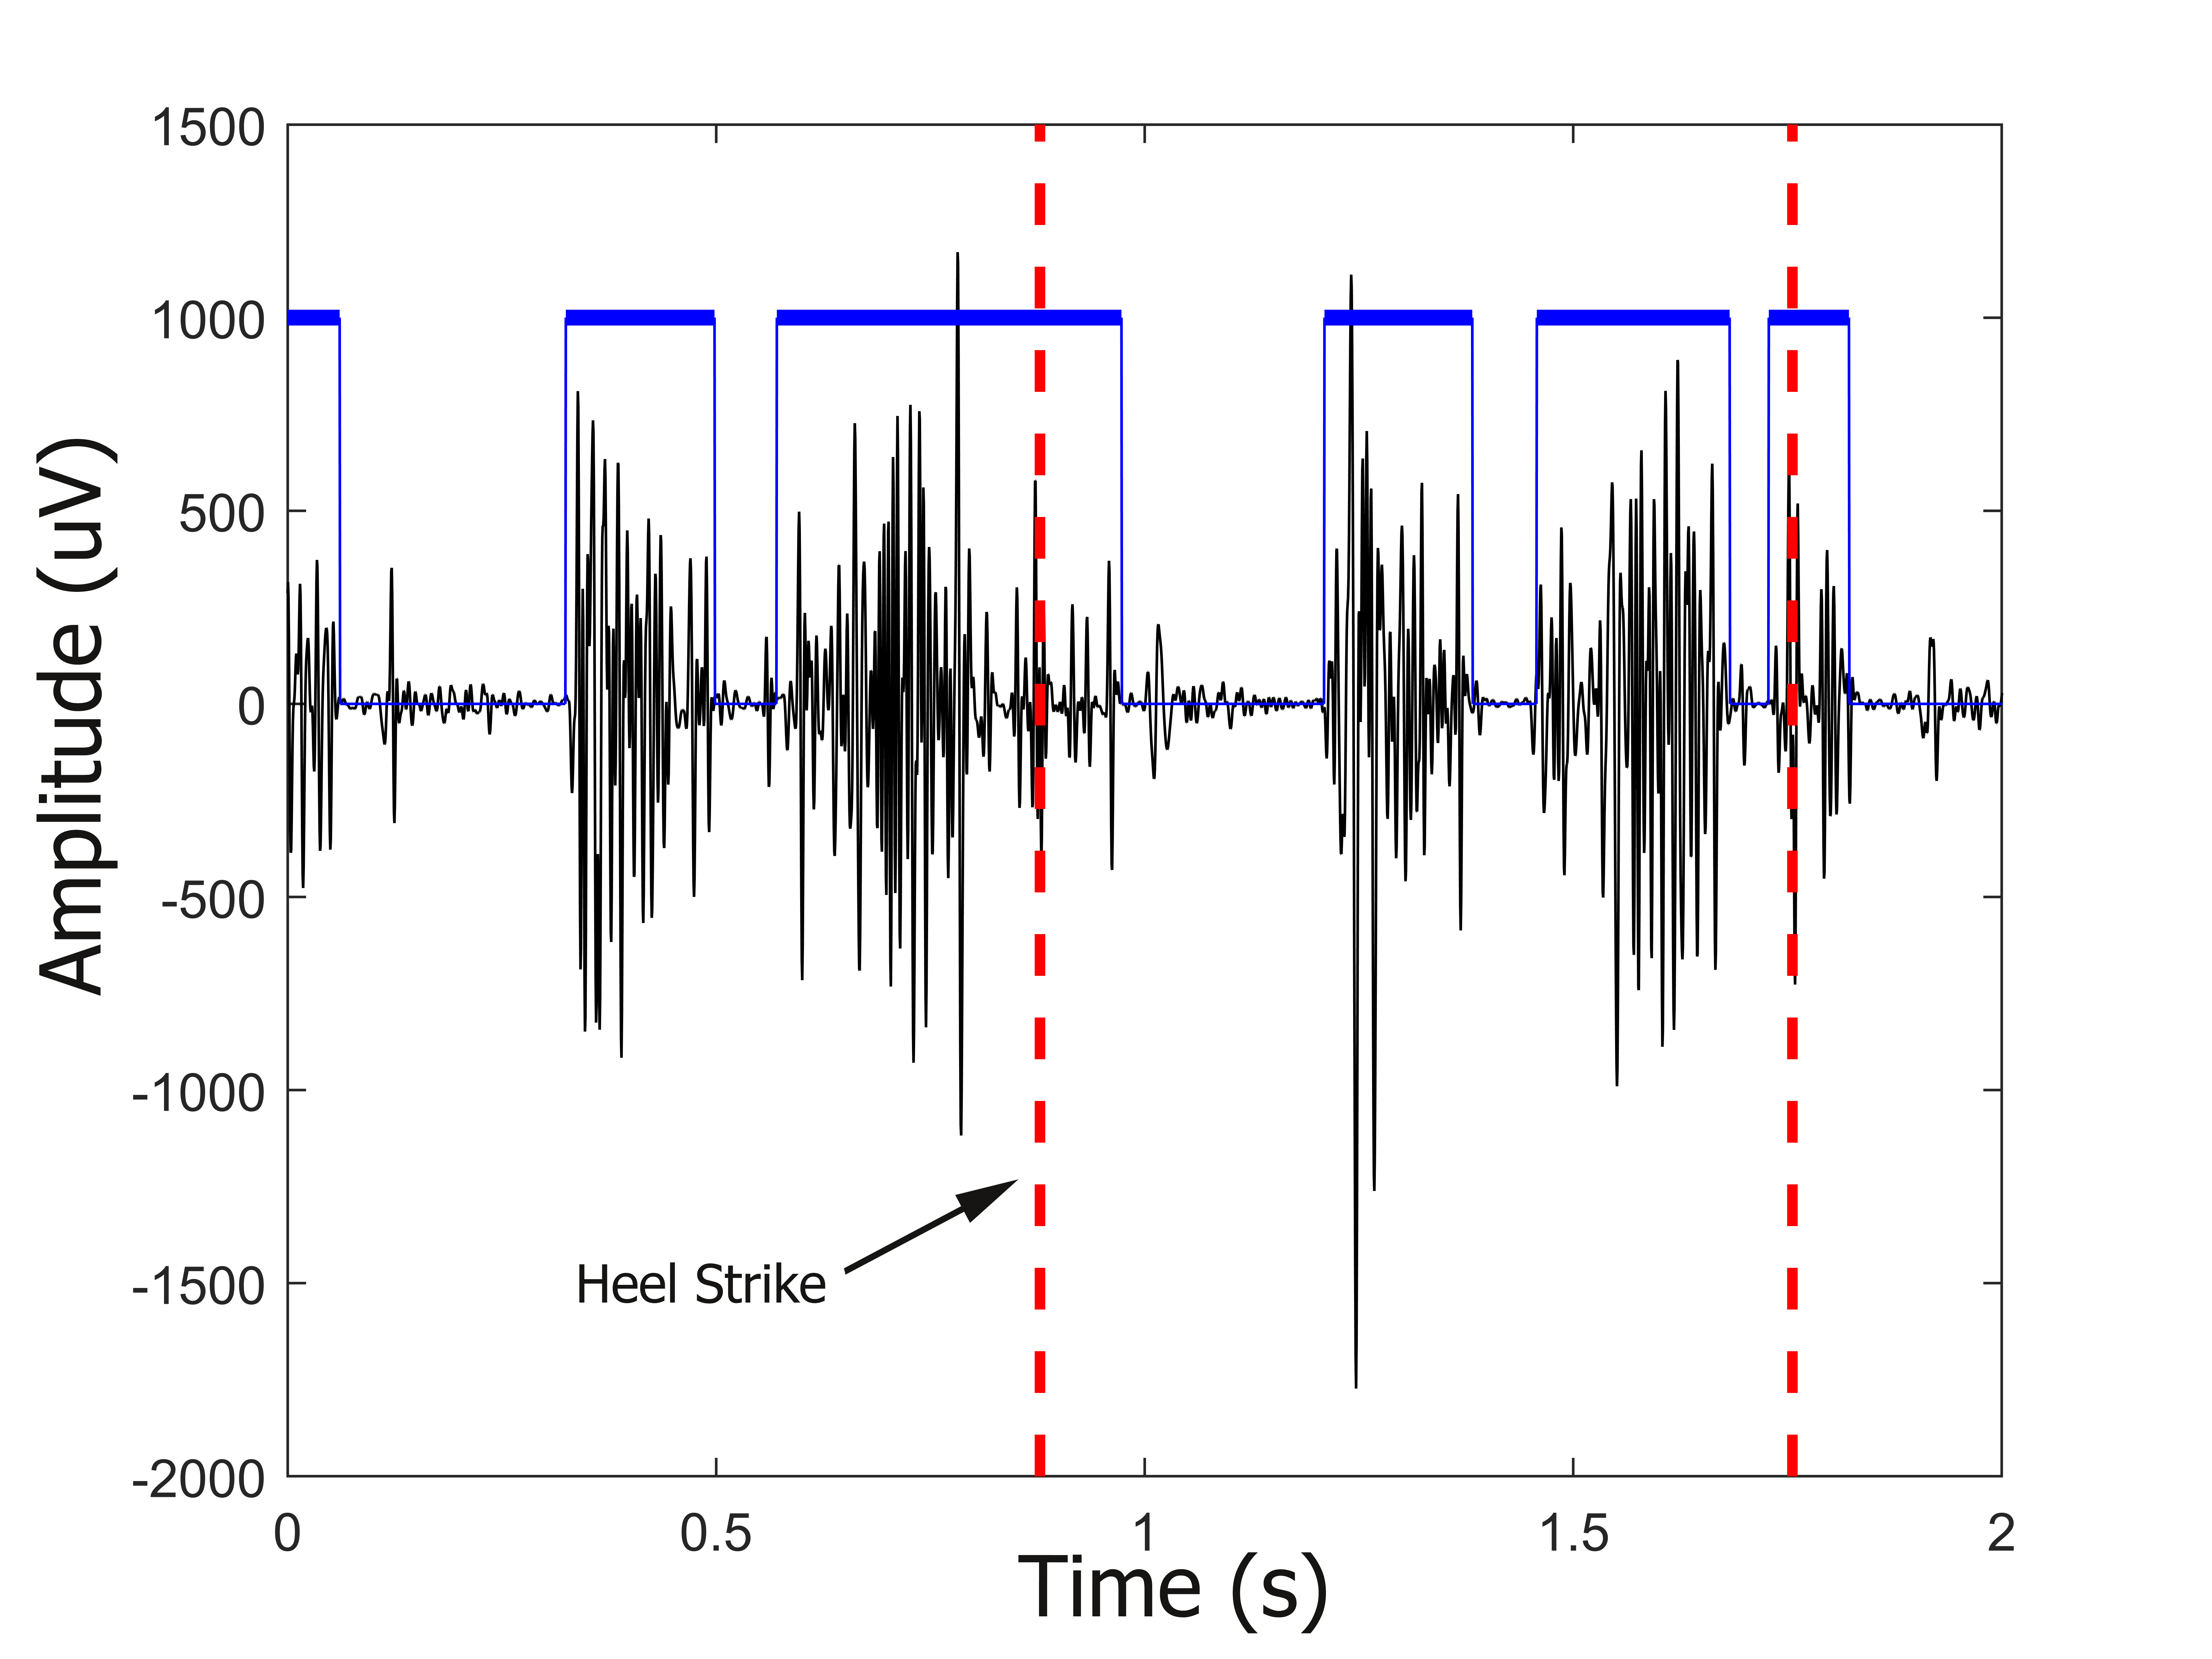
The input dataset must be in a specific format to fit the analysis framework. This section will guide you on how to prepare your dataset to fit the CIMAP data requirements. To work properly, CIMAP requires as input the activation intervals of each observed muscle and side. Muscle activation intervals can be obtained from raw surface electromyographic (sEMG) signals by detecting the beginning (onset) and the end (offset) time-instant of muscle activations during specific movements. In the last years, several algorithms have been published in the literature, spanning from approaches based on double-threshold statistical detectors [1] to approaches based on deep-learning techniques [2]. Independently from the algorithm used to extract the onset-offset intervals, muscle activation intervals are defined as binary masks that are set equal to 1 when a muscle activation is detected and equal to 0 otherwise (see Figure 1). Finally, to avoid biases due to the different time duration of each cycle, muscle activation intervals must be time-normalized to 1000 time samples before CIMAP application.
Input Data Format
The input data must be provided as a .*csv* file containing a \(M×(N+1)\) matrix of muscle activation intervals, where \(M\) represents the number of muscles acquired and \(N\) the total number of time samples after time-normalization. Notice that the first column should contain the labels of each muscle. The label of each muscle should be formatted as follows:
[Name of the muscle, “_”, “L” or “R”]
Accordingly, the label for the left Lateral Gastrocnemius will be “LGS_L“. Here is an example of how the input data should look like:
DATASET |
||||||||
|---|---|---|---|---|---|---|---|---|
column 1 |
column 2 |
column 3 |
column 4 |
column 5 |
column 6 |
column 7 |
column 8 |
… |
TA_L |
1 |
1 |
1 |
1 |
1 |
1 |
1 |
… |
LGS_L |
0 |
0 |
0 |
0 |
0 |
0 |
0 |
… |
TA_R |
1 |
1 |
1 |
1 |
1 |
1 |
1 |
… |
LGS_R |
0 |
0 |
0 |
0 |
0 |
0 |
0 |
… |
Notice that this example was created considering the dataset freely available in the GitHub repository
Output Data Format
Clustering results are saved in an easy-to-read and open-source (.csv file) format to increase results’ accessibility, interpretability, and interoperability. More specifically, the output data will be structured similarly to the input ones. The .*csv* file is structured as a \(M×(C+1)\) matrix, where \(M\) represents the number of muscles acquired and \(C\) the total number of cycles. Notice that the first column should contain the labels of each muscle as defined in the input file. Except for the first column, each column contains a 6-digit ID that stores clustering results as explained in Figure 2.

Figure 2 | Example of a 6-digit ID that stores clustering results. The first and the secodn digits represent the modality of the cycle. The remaining digits identify the cluster to which the cycle is assigned.
The first and the second digits represent the modality of each cycle (i.e., the number of activation intervals occurring within the cycle) and the remaining four digits represent the number of the cluster to which each cycle is assigned. Cycles belonging to non-significant clusters (i.e., clusters characterized by a number of cycles lower than the threshold Th) will have the last four digits set equal to 0. Please refer to CIMAP Documentation for additional details on non-significant clusters.
Here is an example of how the output data looks like:
DATASET |
|||||
|---|---|---|---|---|---|
column 1 |
column 2 |
column 3 |
column 4 |
column 5 |
… |
TA_L |
030002 |
040001 |
030001 |
030003 |
… |
LGS_L |
010003 |
020002 |
010003 |
010003 |
… |
TA_R |
040001 |
020001 |
030002 |
030003 |
… |
LGS_R |
020001 |
010003 |
010001 |
010004 |
… |
Notice that this example was created considering the dataset freely available in the GitHub repository.
References
[1]. P. Bonato, T. D’Alessio and M. Knaflitz, A statistical method for the measurement of muscle activation intervals from surface myoelectric signal during gait. IEEE Transactions on Biomedical Engineering.
[2]. M. Ghislieri, G.L. Cerone, M. Knaflitz et al., Long short-term memory (LSTM) recurrent neural network for muscle activity detection. J. NeuroEngineering Rehabil.
